The call data that moves the revenue conversation.
Dashboards for marketing, attribution reports for finance, conversion metrics for sales, and a full, raw data export for the business intelligence team that wants its own version of all of it.
What is call analytics?
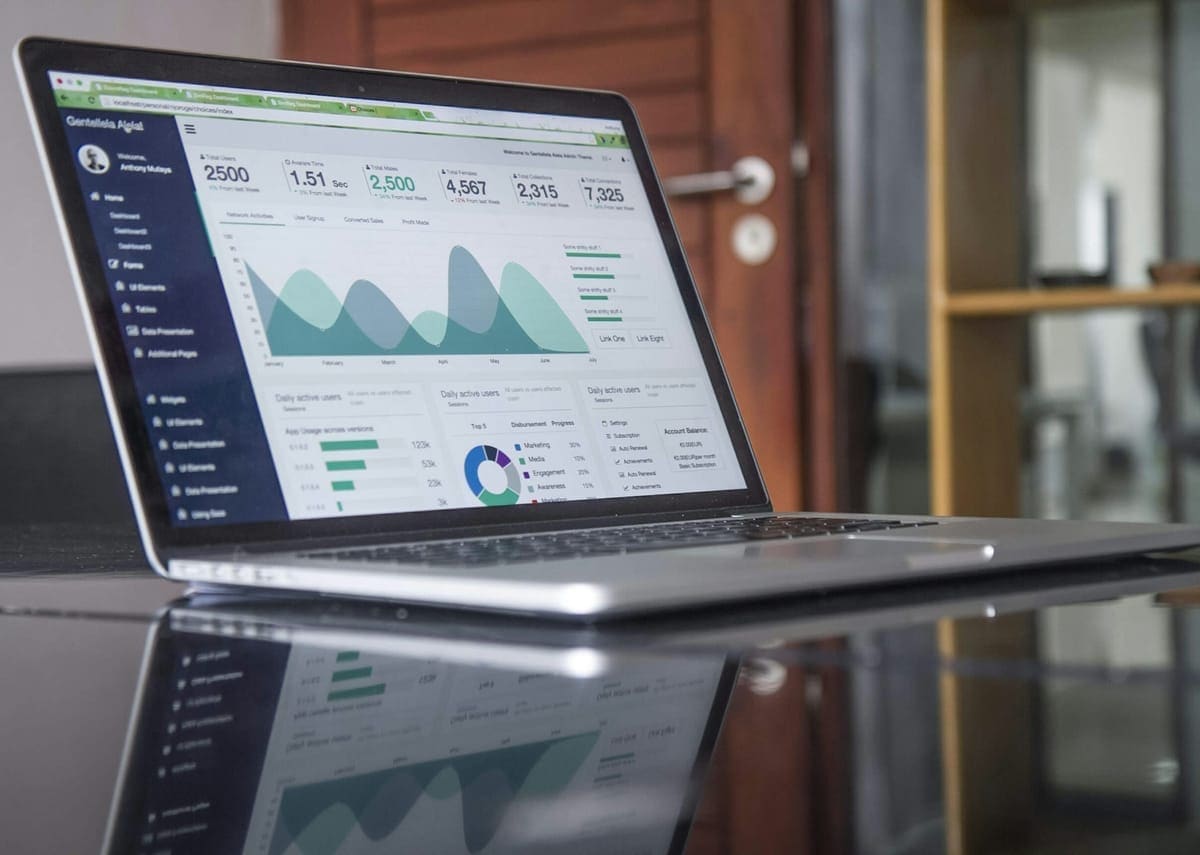
Call analytics turns call data into reports on what drives revenue. iovox reports attribution by source, campaign, keyword and landing page, and traces what happened after each call: booked, sold, refunded or escalated.
Dashboards, reports, exports: in that order.
Source, campaign, keyword, and landing-page call attribution, in the same view your team already uses for campaign performance.
- Source, campaign, and keyword call volume breakdowns
- Saved views per campaign, team, or region
- Share links with clients and agencies
What happened after the call, whether booked, sold, refunded, or escalated, traced back to the call event.
- Funnel conversion across sources and campaigns
- Time-to-close, deal value, repeat-caller metrics
- Exportable reports with redaction controls
Don't like our dashboards? Use your own. Every call event, every attribute, every transcript, pushed where your team already works.
- Route via API or webhooks into BigQuery, Snowflake, Redshift, or S3
- Batch export via CSV for any downstream tool
- Consistent field structure, built to plug into your existing platforms
Every level of your organisation sees the data that's relevant to them. Corporate gets the global picture, regional managers see their patch, and local teams see their location.
- Global roll-up dashboards for the corporate office
- Regional views scoped to each manager's territory
- Location-level reporting for every individual site
The metrics that justify the spend.
"Now what we can do is actually have a transparent conversation on those metrics and say, this is what your project profile is delivering; it helps us actually justify the ROI metrics and the cost of the product."
Frequently asked questions
What can I see in iovox call analytics?
Call attribution by source, campaign, keyword and landing page, plus what happened after each call: booked, sold, refunded or escalated. Dashboards update in real time.
Can I send call data to my data warehouse?
Yes. Every call event, attribute and transcript can go by API or webhooks into third party tools.
Can regional teams see only their own data?
Yes. Head office sees global roll-ups, regional managers see their territory and local teams see their own location.
Can I share call reports with clients and agencies?
Yes. Saved views can be shared by link with clients and agencies.
The conversion metrics that change the revenue conversation.
Your business has hundreds of important customer conversations every day. iovox analytics gives you a unified view of all of them.